Versions Compared

Key

  • This line was added.
  • This line was removed.
  • Formatting was changed.

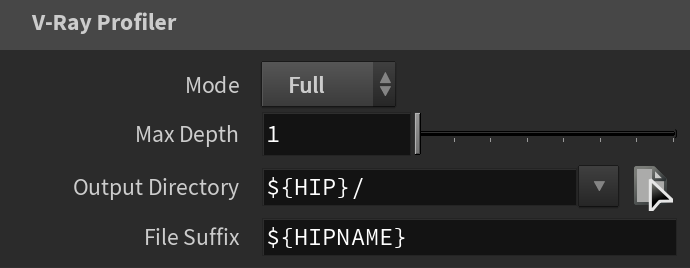
This page provides information about the V-Ray Profiler tool.


Overview

...

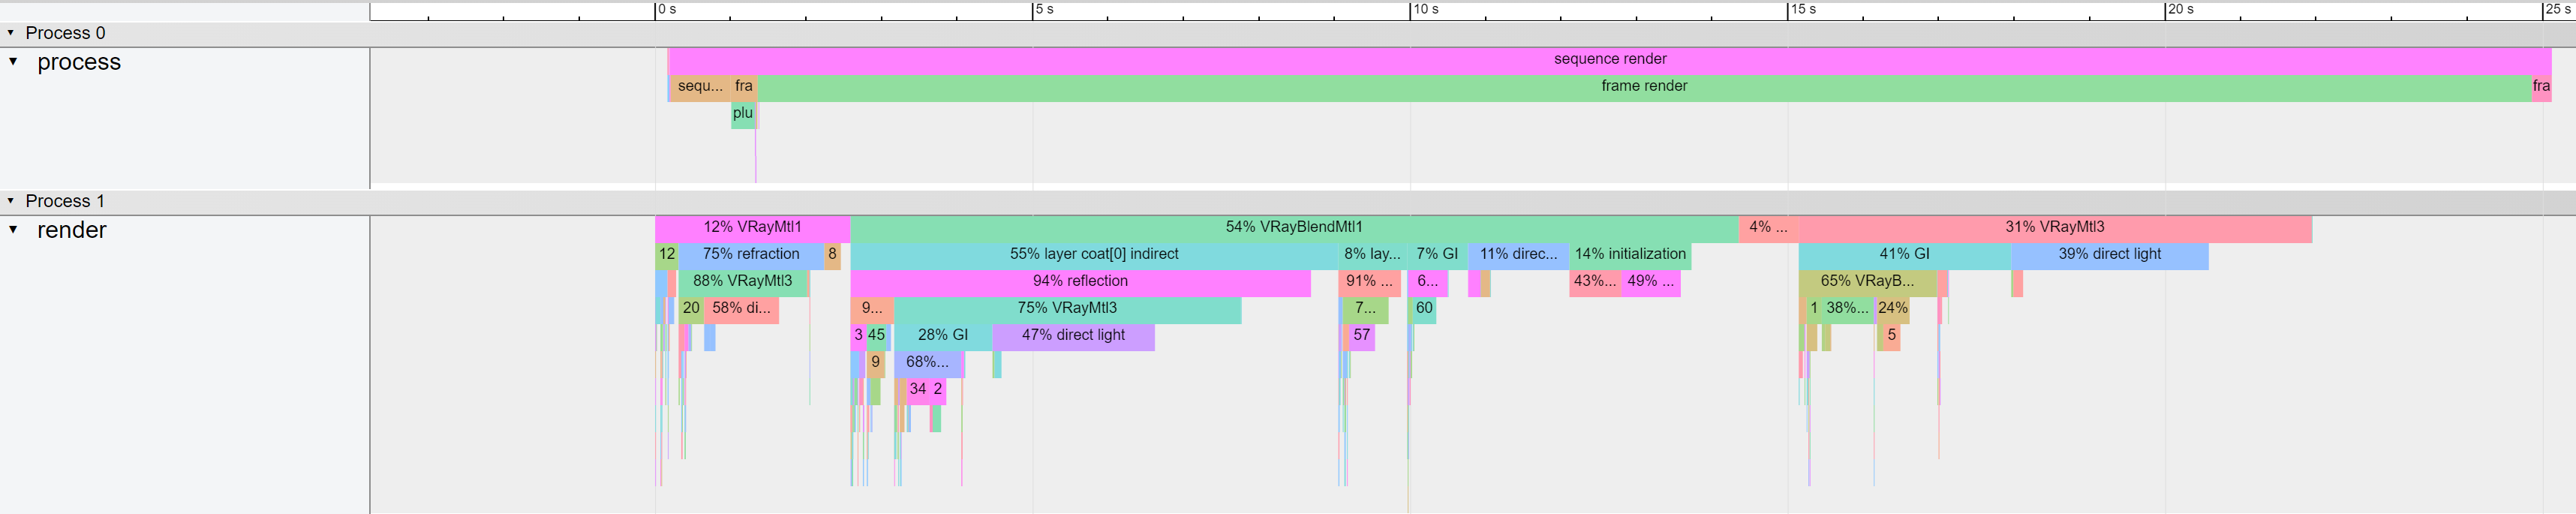
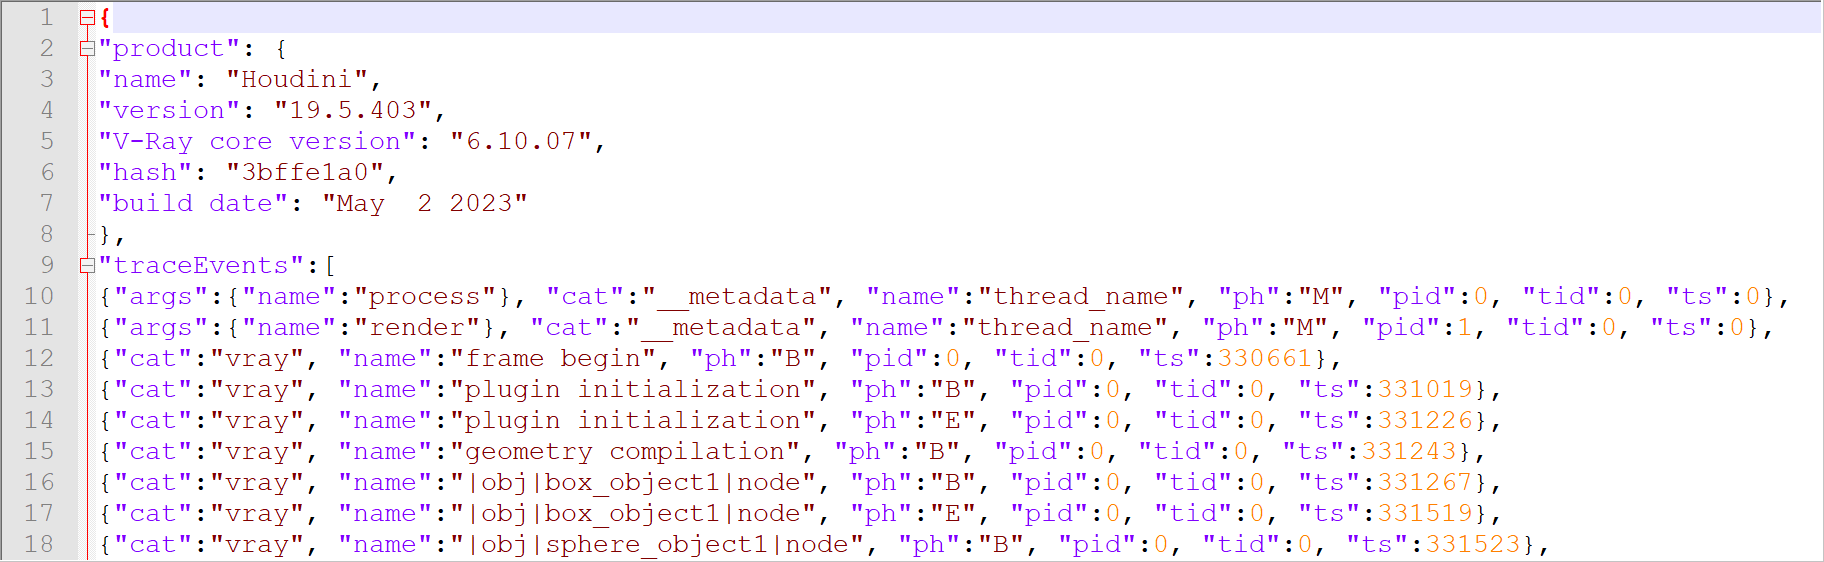
V-Ray Profiler helps determine what parts of the scene are taking the longest time to render, compare the performance of different material settings and figure out the best settings for your scene. It does that by tracking the time spent in sampling shaders (materials and textures) and volumes during rendering and breaking down the different types of calculations done for each shader, such as GI, Reflections, Refractions, etc. It writes a JSON formatted report and an HTML report. Both can be read by a browser tracking software, the .json file can also be opened in a text editor offline.

...

UI Text Box
typenote

V-Ray Profiler is partially supported on V-Ray GPU. The Full Profiler mode is not supported on V-Ray GPU.

...


UI Paths:

||V-Ray Shelf|| > ROP Parm > Renderer tab > Options tab > Rendering tab > V-Ray Profiler

...

 
Expand
titleClick here to see the paths in Houdini...


...


Settings

...

Section
Column
width55%

Mode – Determines the mode in which V-Ray Profiler works.

Off – V-Ray Profiler is disabled.
Simple – Reports the time spent on system processes such as compiling geometries, building the Light Cache, exporting the scene from Houdini to V-Ray etc. Suitable for most scenes.
Full – Provides an in-depth report. It includes detailed information such as time of calculation per shader e.g. how much time is spent calculating the reflection of a shader, as well as what shaders are reflected in it and how long it took sampling them. This mode is suitable for scenes that include views through glass window or in a mirror reflection. This mode can slow down the render by up to 20%.

Max Depth1– Determines the amount of bounces the rays make after coming into contact with an object. Keep in mind that this option depends on the materials' Reflection and Refraction Max depth parameters. If the GI is set to Brute Force, its Depth parameter influences the value of the V-Ray Profiler's Max depth. This is reflected in the resulting profile.

Output Directory – Specifies the location and name of the output files.

File Suffix – Specifies a suffix that is appended at the end of the profiler report files.

 
Column
width5%


Column
width40%


Workflow

...

Fancy Bullets
typecircle
  • Turn on the V-Ray Profiler by changing the Profiler Mode to Simple or Full.
  • Set the output location of the .json and .html files. If this field is left empty, the generated files are saved in the default Temp folder in your system.
  • Render your scene2. Once you finish the render, you are able to find the .html and .json files in your designated directory. Rendering a second or third time generates more reports. Up to 3 reports can be generated in the same folder. Generating more, without changing the Output directory, causes the oldest report to be replaced by the new one.
UI Text Box
typetip

You can check the output file location in the log file.

  • Open the generated report3.

    To open the .json file:
    Go to a third-party tracking software. We recommend using Google Chrome's tracer. Open Google Chrome and enter chrome://tracing/ in the URL field. Drag and drop your .json report onto Google Chrome and explore. The report shows the duration it took to render each element in nanoseconds. Alternatively, you can open the .json file in any text editing software on your machine.

    If you want to open the .html file:
    Double-click on the file and it opens the report in the default browser. Most browsers are suitable for this. Explore the report. The report shows the duration it took to render each element in nanoseconds.
  • You can view the report's metadata either through the button in the browser report, or at the top of the .json file, when read through a text editor, under "product".
UI Text Box
typetip

If, at any point during the render, the CPU performance drops, a High bundle size wait section appears in the profiler. You can explore the stats associated with it.

Expand
titleClick here for an example...

Section
 
Column
width5%


Column
width90%

Example of a result in All mode opened in a browser

Column
width5%


...


...


Section
 
Column
width5%


Column
width90%

Example of a result in System mode opened in a browser

Column
width5%


...


...


Section
 
Column
width5%


Column
width90%

Excerpt from a .json report opened through a text editor

 
Column
width5%


Anchor
notes
notes


Notes

...

Fancy Bullets
typecircle
  1. If there is only layered materials in the scene (e.g. VRayBlendMtl) and the Max depth parameter of the Profiler is set to 8, no more than 5 ray bounces are displayed in the profile. Make sure to lower the Max depth for an accurate reading of such a scene.
  2. If you are rendering a scene with Bitmaps multiple times, the Bitmaps will not be read by the Profiler after the first render. To profile the Bitmaps after the initial render, you need to go to Render Settings > Overrides> Rendering and click on Clear bitmap cache. Then you can proceed with a second render.
  3. When reading a Profiler report in a browser, keep in mind that only up to 16 simultaneous events can be displayed. Simultaneous events are stacked down on each other when displayed this way and only up to 16 can fit at the same time, even though V-Ray can render more.