Versions Compared

Key

  • This line was added.
  • This line was removed.
  • Formatting was changed.

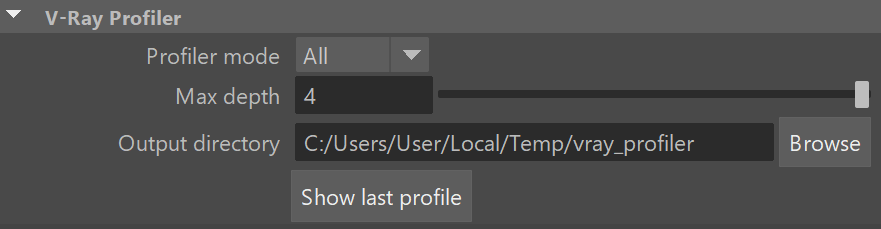
This page provides information about the V-Ray Profiler tool.


Overview

...

Section
Column
width50%
UI Text Box
typenote

V-Ray Profiler is partially supported on V-Ray GPU. The All Profiler mode is not supported on V-Ray GPU.

V-Ray Profiler helps determine what parts of the scene are taking the longest time to render, compare the performance of different material settings and figure out the best settings for your scene. It does that by tracking the time spent in sampling shaders (materials and textures) and volumes during rendering and breaking down the different types of calculations done for each shader, such as GI, Reflections, Refractions, etc. It writes a JSON formatted report and an HTML report. Both can be read by a browser tracking software, the .json file can also be opened in a text editor offline.

The V-Ray Profiler report breaks down the tracked time into a few categories: Initialization, GI, Reflection, Refraction, and Others. These categories are only tracked if they were used by the shader. For example, a VRayMtl with no refraction enabled does not report anything for Refraction. The same happens if a shader with no Reflection layer is used.

For volumes, the Profiler reports the time spent calculating each volume in your scene.

See the introductory article in Chaos' blog for more information.

Column
width5%


Column
width45%
HTML
<iframe width="560" height="315" src="https://www.youtube.com/embed/UrKFES4PFWU?si=XtUrlb30b8iLvUTe" title="YouTube video player" frameborder="0" allow="accelerometer; autoplay; clipboard-write; encrypted-media; gyroscope; picture-in-picture; web-share" referrerpolicy="strict-origin-when-cross-origin" allowfullscreen></iframe>


UI Path


||Render Settings|| > Settings > System V-Ray Profiler


Settings


Section
Column
width57%

Profiler mode – Determines the mode in which V-Ray Profiler works.

Off - V-Ray Profiler is disabled.
System - Reports the time spent on system processes such as compiling geometries, building the Light Cache, exporting the scene from Maya to V-Ray etc. Suitable for most scenes.
All - Provides an in-depth report. It includes detailed information such as time of calculation per shader. For example, it shows time spent calculating the reflection of a shader, as well as what shaders are reflected in it and how long it took sampling them. This mode is suitable for scenes that include views through glass window or in a mirror reflection. It can slow down the render by up to 30%. This mode is not available with V-Ray GPU.

Max depth – Determines the amount of bounces the rays make after coming into contact with an object. Keep in mind that this option depends on the materials' Reflection and Refraction Max depth parameters. If the GI is set to Brute Force, its Depth parameter influences the value of the V-Ray Profiler's Max depth. This is reflected in the resulting profile. If entered manually, the Max depth value can go up to 81, however this is not recommended as it significantly slows down the render.

Output directory – Specifies the location and name of the output files.

Show last profile – Redirects to a browser, where the last profiler report is opened as an .html file. Note that this option shows the last report from the current session. If you open a new Maya scene, this button displays an error.

Column
width5%

Column
width38%


...